You put a great deal of effort into creating the perfect reel, but your work isn’t finished after hitting ‘send.’ It’s also really important to track what clients do once your presentation arrives in their inbox. Analyzing reel performance and identifying standout spots, or scenes within spots, helps you make smarter, more strategic choices when creating follow-up reels or presentations.
This is why we’re excited to introduce Engagement Graphs, which equip creative companies with actionable reel viewing data, empowering them to send better-targeted work and win more jobs.
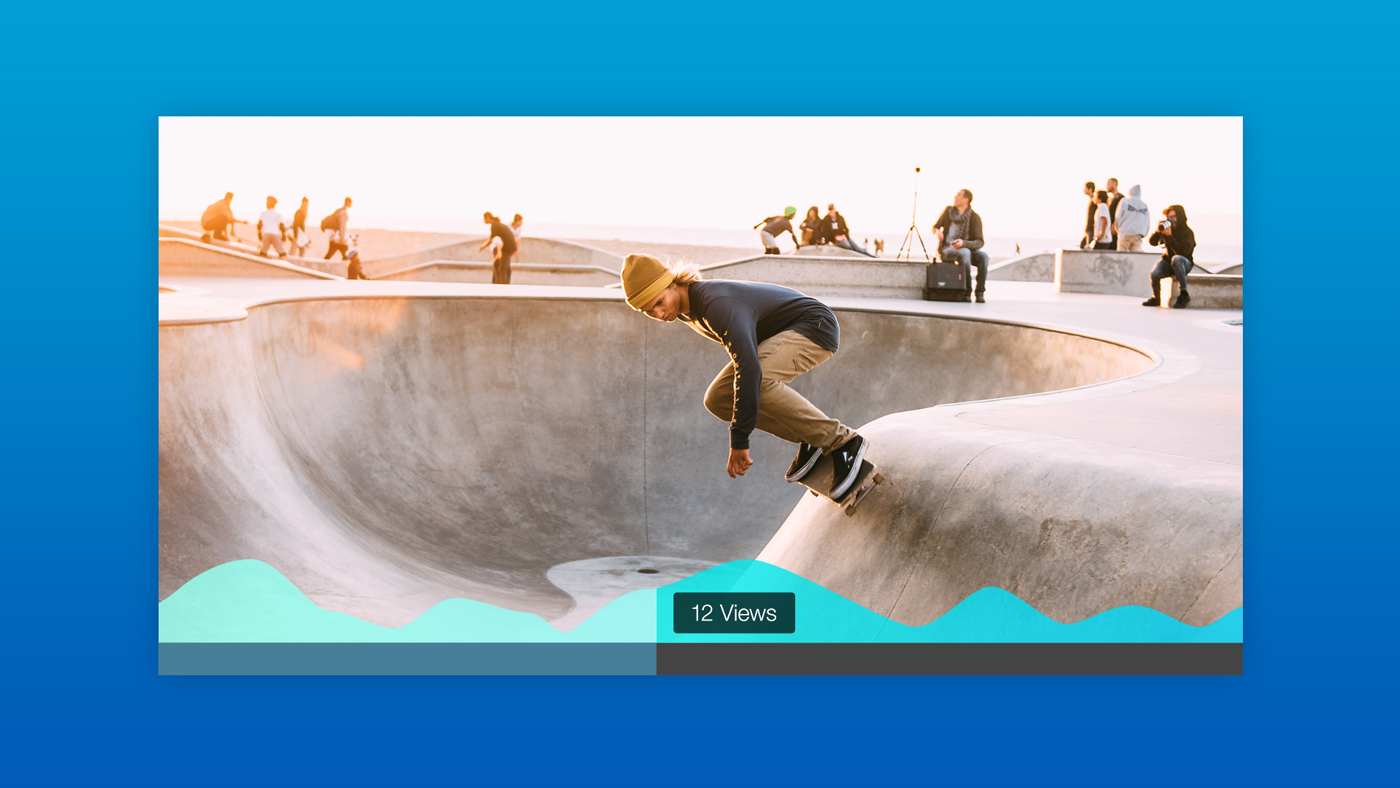
Our new Engagement Graphs have replaced our video heatmaps and provide a clearer visual representation of video views. You can see instantly what recipients watched, what they rewatched and where they dropped off.

Left: Heatmaps (old); Right: Engagement Graphs (new)
What Are Engagement Graphs?
Engagement Graphs tell a story of what clients are watching. As the video plays, the Graph syncs with the video timeline; the higher the colored area of the graph extends, the more views. This lets you see so you can see exactly how many times each scene has been screened. You can also sift through the video to any point in the timeline to see how that segment of the spot or scene worked in terms of viewer engagement.
For more on how to use engagement graphs, check out our knowledge base article.

What You’ll Learn
Knowing what spots or scenes clients are watching, and understanding where their attention drops off, provides so much value when choosing the right spots for the job. When you don’t measure reel engagement, it can be difficult to sharpen your sales approach, resulting in miss opportunities for your directors, your editors, your artists or your studio. This data will help you send work tailored for your client's interests.
“If our work samples weren’t hitting their mark, we could use heat mapping to make immediate changes and better deliver what our clients needed — sometimes, before they asked for it.”
Bernadette Rivero, President, Cortez Brothers
Get the Full Picture
Engagement graphs are part of the whole industry-leading Simian analytics package. Using individual video viewing data, combined with overall reel viewing data, helps you draw conclusions on how your reel performed overall.
For example, if you notice views drop off after the first four spots, then you might consider reordering the work on your reel to lead with content that scores higher on the Engagement Graph.

Are you ready to send better, smarter and sharper reels? See what you’ll learn from analytics when you start a free 7-day trial.

MORE FROM THE SIMIAN BLOG

Roland Gauthier, Hinge
What a difference ten years can make.Back in 2009, the newly launched Hinge Digital (...

Cameron Woodward, Film Casualty
You’d think a conversation with Cameron Woodward would revolve around the latest image capture technology or a rece...

Ed Rivero, CBG United
Ed Rivero has seen just about everything in the course of his advertising career, but he confesses that nothing quite...
Single Sign-On (SSO)
Unlock the power of Simian with single sign-on (SSO)! Simian currently supports Okta, G-Suit...

Add SSO to Simian
We don’t need to tell you how incredibly important privacy is when it comes to your projects and client ...